Downtime/OEE
Downtime data collection and OEE performance calculations.
Contents
- 1 User Access and Administration
- 2 Shop Floor User
- 3 Admin User
- 4 Maintenance User
User Access and Administration
QC Results Downtime data collection has two user modes:
- Shop Floor User
- Administrative User
Privileges
- Shop Floor Users have privileges to:
- Create a Run Time on an Asset
- Record a Downtime Event on a Run
- Edit a Downtime Event on a Run
- Close a Downtime Event on a Run
- Close a Run Time on an Asset
- Administrative Users have privileges to:
- Edit closed Run Times on an Asset
- Edit Downtime Events on a closed Run
Entity Access
- PIN Numbers
- PIN numbers are used when Runs or Downtime Events are created and closed. This allows for users to enter event information while not necessary being the user logged into a terminal.
Shop Floor User
The following instructions are for the typical shop floor user tracking downtime. This can be on a hand-held device, a kiosk station, a tablet or a desktop computer.
Launching Application
When running the application through the Studio, select the button on the menu. In kiosk mode, click on the QC/Downtime icon to launch the program.
Logon
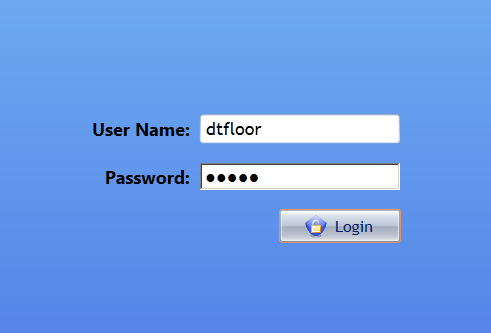
The logon screen is presented at start-up. You must have a QC Results user name and password along with the appropriate access permissions to launch the application.
Downtime Asset List
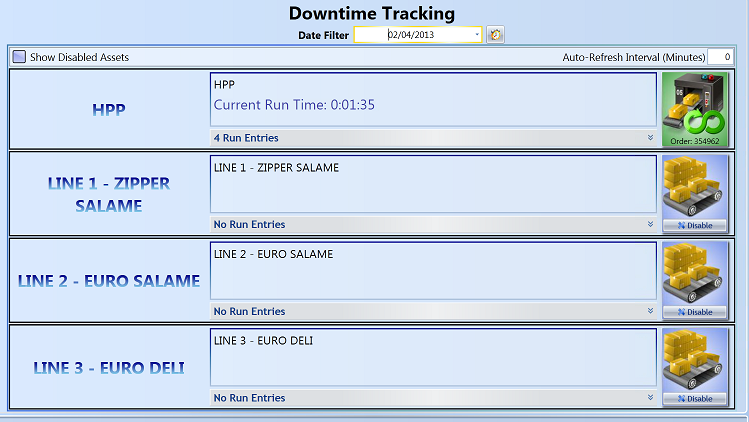
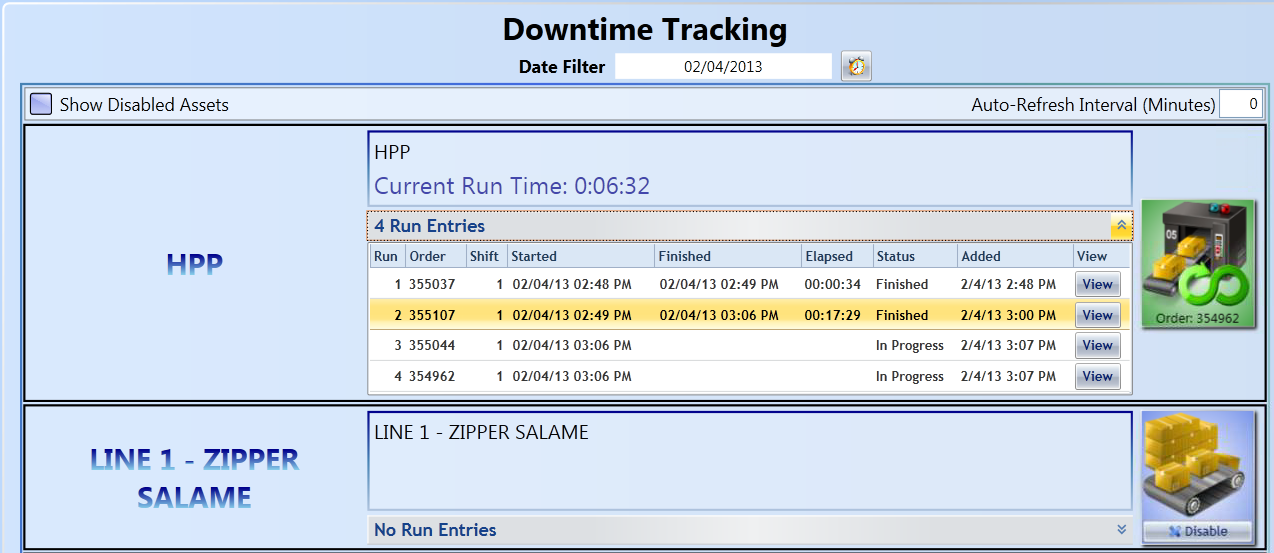
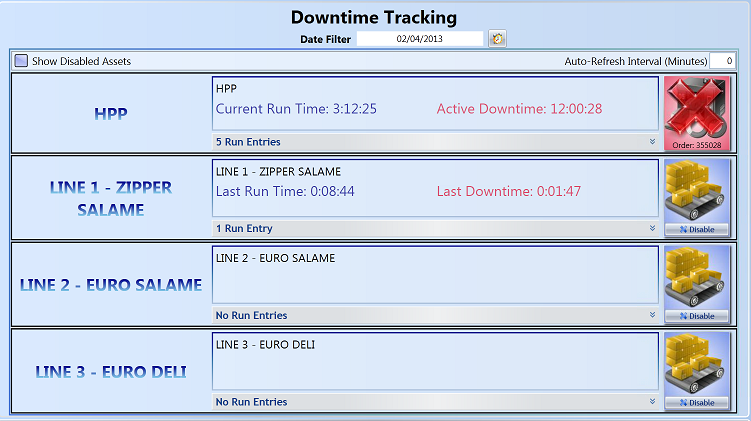
After logging into the application, the user will be presented with the Downtime Asset List. This list consists of all of the Assets the user has access permission to see. From here, each Asset can be monitored and a Run established for collecting Downtime events.
Date Field Filter
Each set of Run and Downtime Events collected by the system are filtered by their start date. The system will default to the current date when logging in. Select the date you want to use for collecting Runs and Downtime Events, or for editing previous Runs and Downtime Events.
Auto-Refresh Interval (Minutes)
If you want to automatically refresh the Asset list and the status information, fill in this field with the desired interval. The default is "0", which means the list will not be automatically updated.
Asset Filter Radio Button
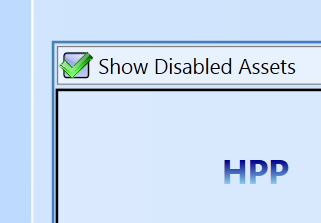
The "Show Disabled Assets" button in the upper left corner is used to toggle the display of Assets in the list that are Disabled. This function is useful to unclutter the Asset List when managing several Assets at a time.
Accessible Assets
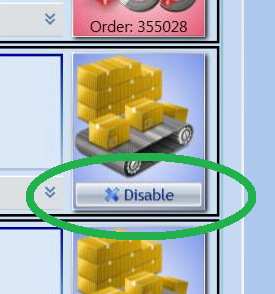
Clicking Disable will mark the Asset as Disabled so it can be filtered out of the Asset List.
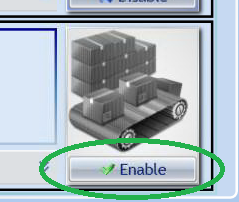
Clicking Enable will mark the Asset Enabled and ready so it can be included in the Asset List of active Assets, ready for a run to be assigned.
Asset List
The Asset List is generated from a list of the available, assigned Assets to the user's access permission. Each Asset has its own row and is sorted by availability and Asset name. Each row consists of several performance indicators. The left most title is the Asset Name. The inner control box will list the Asset Description, current or last run length, current or last downtime length, among other information. At the bottom of this inner control box is a drop-down list. It shows the count of Runs made against the Asset for the day. Toggling the right-most arrow will toggle the drop-down information grid. This grid will show each Run for the day on the Asset and allow entry into the Run for auditing or editing with given access permission. The right most button is the Asset Status Indicator/Run Start/Downtime Action Button.
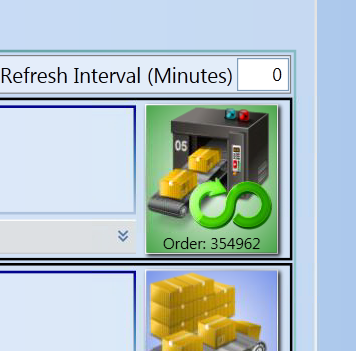
Asset Status Indicator/Run Start/Downtime Action Button
This right-most button on each Asset row is used to do one of three actions:
1) Indicate status of the Asset.
2) Start a new Run on the Asset if it currently is Enabled and does not have a Run assigned.
3) Jump to the Downtime Collection screen when the Asset has a Run assigned to it.
Assigning an Asset a Run
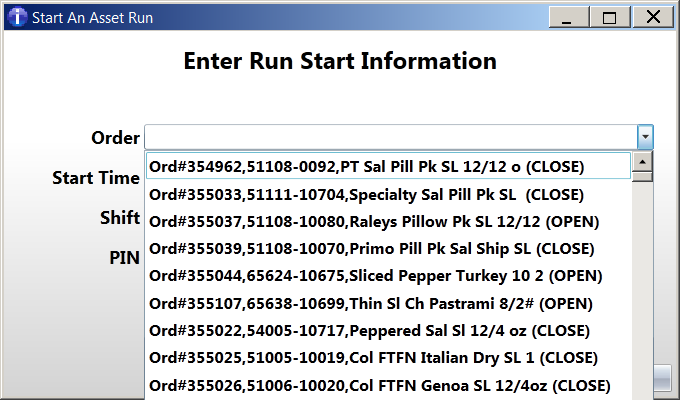
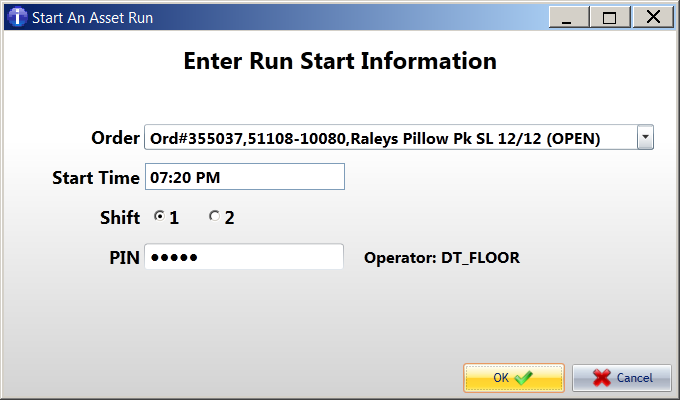
If your Asset is Enabled and does not have a Run assigned to it, you can start one by clicking on the right-most button on the Asset row. You will be asked to select an order for the Asset to run against.
You will then be asked to enter or update the start time of the Run. This is defaulted to the current system time.
If this is not the first run of the day, the time will automatically be the ending time of the last run.
Select a shift and enter your PIN number, then hit the "OK" button. The Run will begin.
Access Downtime Collection Screen
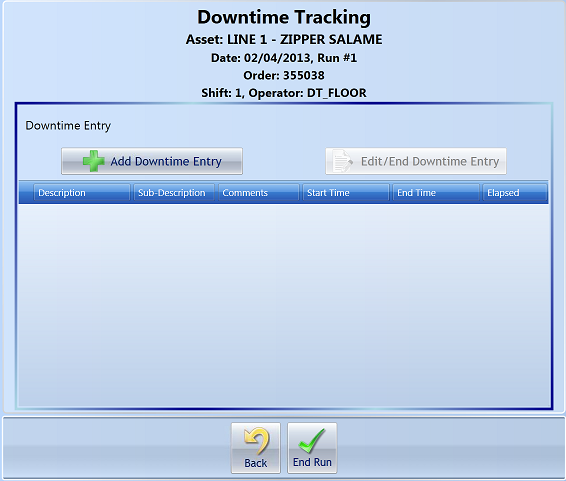
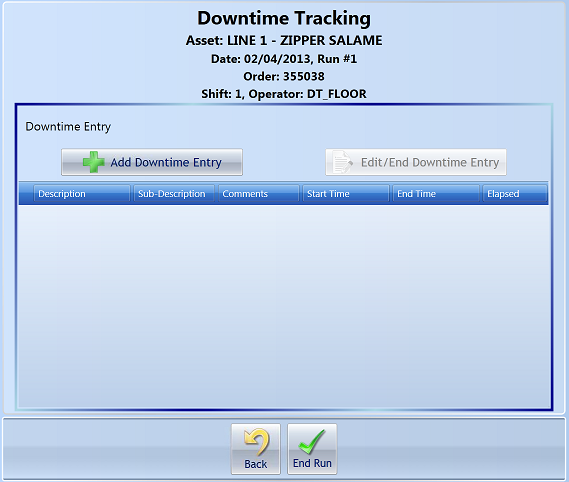
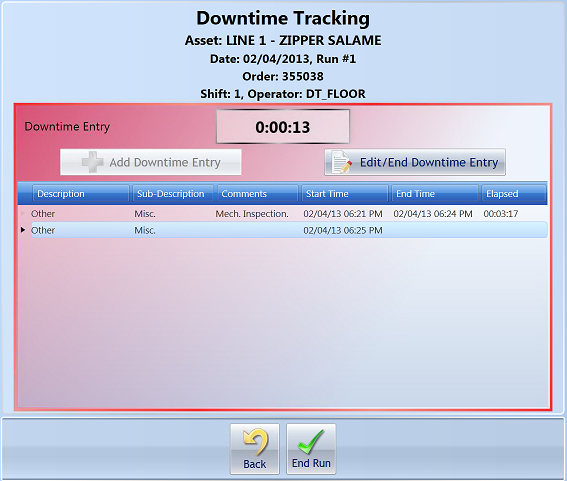
If your Asset already has a Run against it and you wish to collection Downtime Events, you will need to click the right-most button on the Asset row. This will take you to the Downtime Collection screen. The Downtime Tracking window will display at the top of the window. It will list the Asset and the Run details. The center of the window is used to display a grid of Downtime Events that have been recorded against the Run as they are added.
Highlight the "Add Downtime Entry" button.
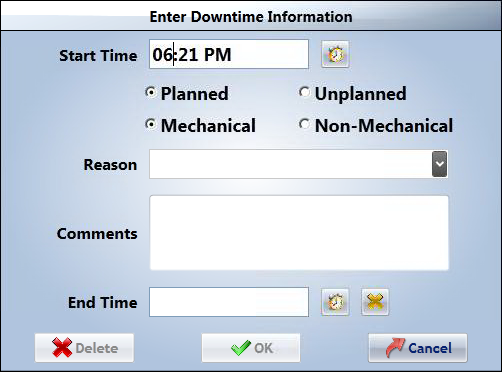
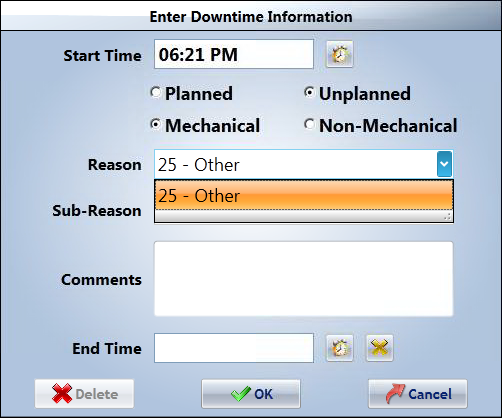
The user will be asked several questions about the Downtime Event.
The Start Time will be defaulted to the current system time. This is completely editable by the user to reflect the true start of the downtime.
Select whether the event was Planned or Unplanned.
Select whether the event was Mechanical or Non-Mechanical.
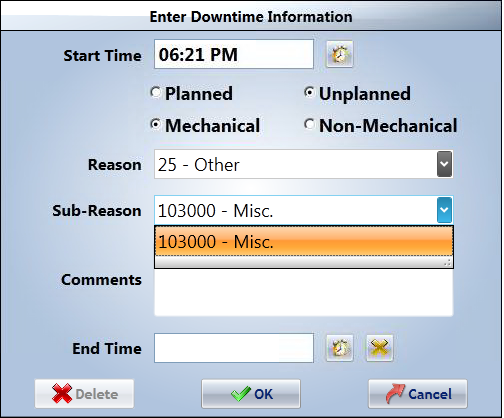
You will be given a drop-down to select the Reason Code from for the Downtime Event.
Next, select the Sub-Reason Code from the next drop-down for the Downtime Event.
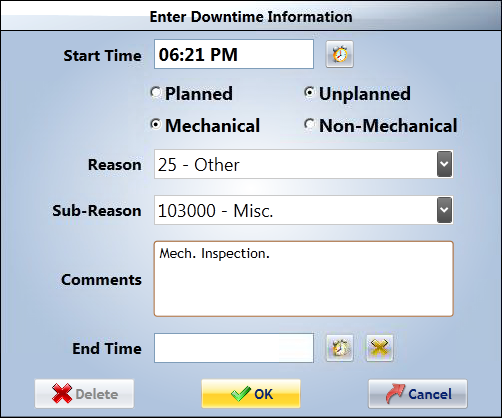
You may enter a comment in the comment field.
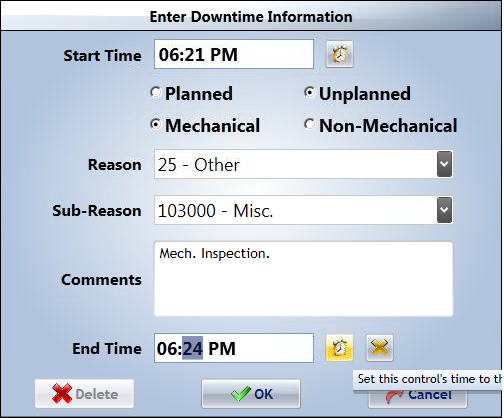
You may or may not enter the End Time, depending on if you are reporting after the fact or in real time.
You can use the icons to the right of the time fields to default the current time into the field or clear the field.
You can select "OK" to start the Downtime Event.
You can select "Delete" to delete the Downtime Event.
You can select "Cancel" to return to the previous window.
Creating a Downtime Event will turn the window and Asset Status Button red to indicate that the Asset is currently experiencing a Downtime Event.
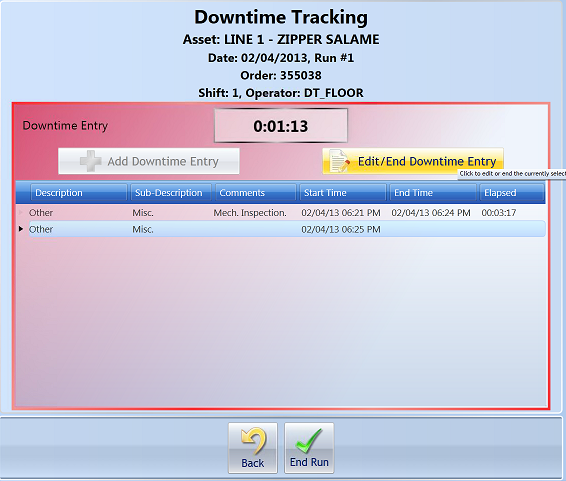
You can Select the "Edit/End Downtime Event" button to edit the information recorded in the Downtime Event or to End it.
Ending a Downtime Event records the information to the Downtime grid and places the Asset back in the normal Run mode.
Closing an Asset Run
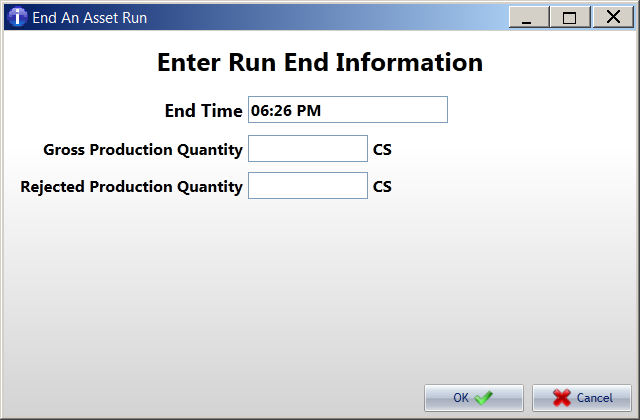
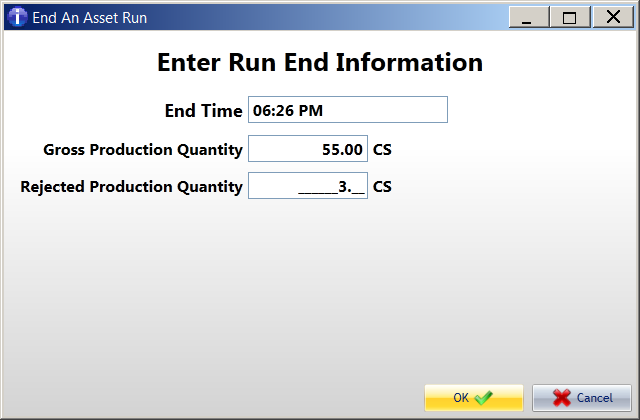
Closing an Assets Run is done within the Downtime Collection window. The "DONE" button on the bottom menu bar can be pressed to close a Run. The user will be presented with an End Asset Run window and asked for the actual end run time. The current system time is defaulted. The user is also asked to provide the Gross Production Quantity and Rejected Production Quantity. The system will suggest quantities based off of production data when available.
When the information has been provided, the user can select the "OK" button to record and close the Run.
Asset Behavior
If the Asset is running, you will see a green indicator on the right most button in the Asset row. If the Asset is not running, the Asset will be gray. If the Asset is experiencing a Downtime Event, the Asset button will be red.
Close Button/Kiosk-Tablet mode
When finished with Downtime, you can close the kiosk mode by the power off button in the top right corner.
Admin User
Main Form Window (Downtime Asset List)
Differences in Asset List
Differences in Downtime Collection Screen
Maintenance User
GX Studio
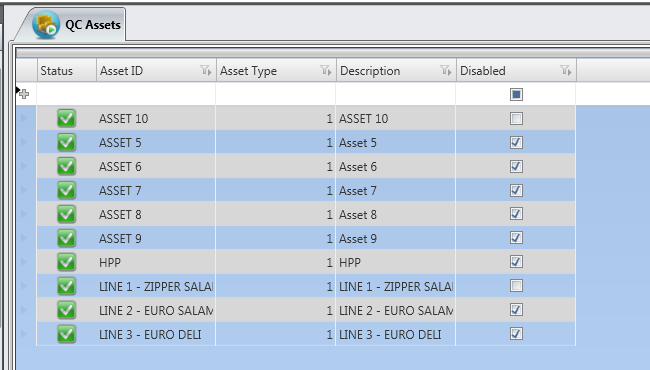
QC Assets Maintenance
In order to access this screen, you need to have the "SD QC ASSETS" permission set for your user.
This table is where you enter the information regarding the assets you wish to report on. All fields are manual entry; no information is coming from other tables.
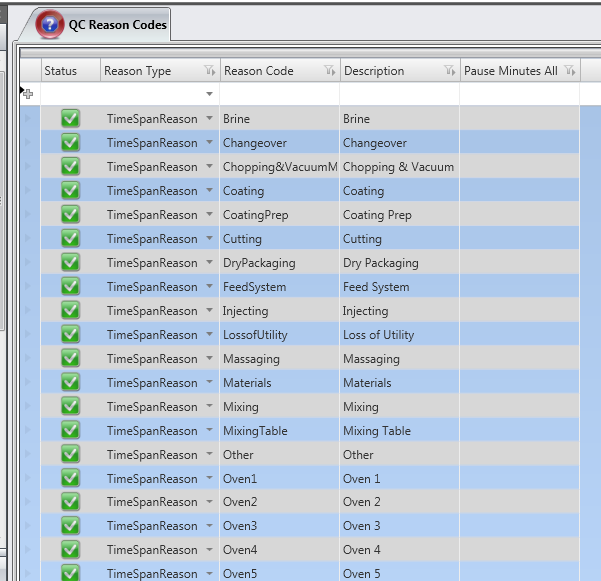
QC Reason Codes Maintenance
In order to access this screen, you need to have the "SD QC REASON CODES" permission set for your user.
In this table you can set up the reason codes needed for QC. First, select the Reason Type from the drop-down list (Reason Types are set up in the code), then enter the rest of the information.
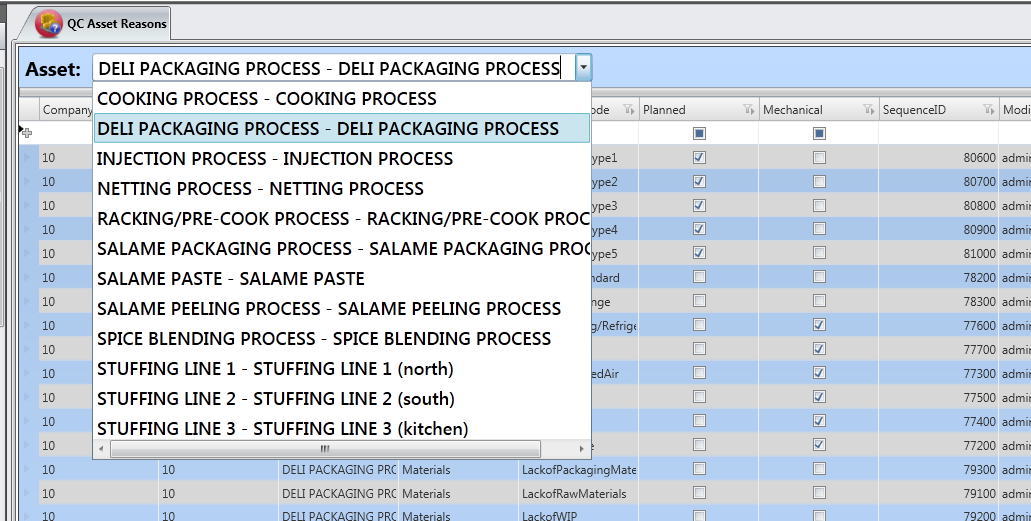
QC Asset Reasons Maintenance
In order to access this screen, you need to have the "SD QC ASSET REASONS" permission set for your user.
In the Asset drop-down, select an Asset. These are the same Assets entered in the QCAsset table. The grid will fill with all reasons currently associated with that Asset. You can edit existing reasons, or assign new reason to the Asset using this screen.
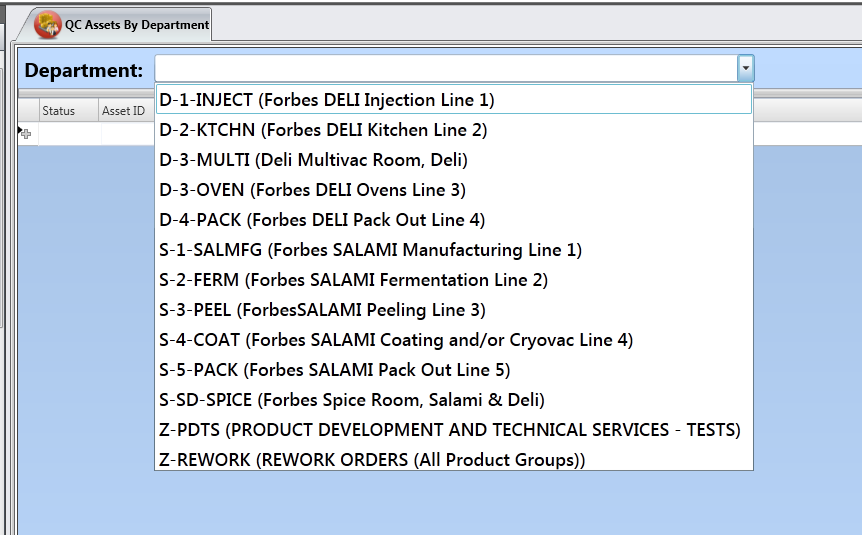
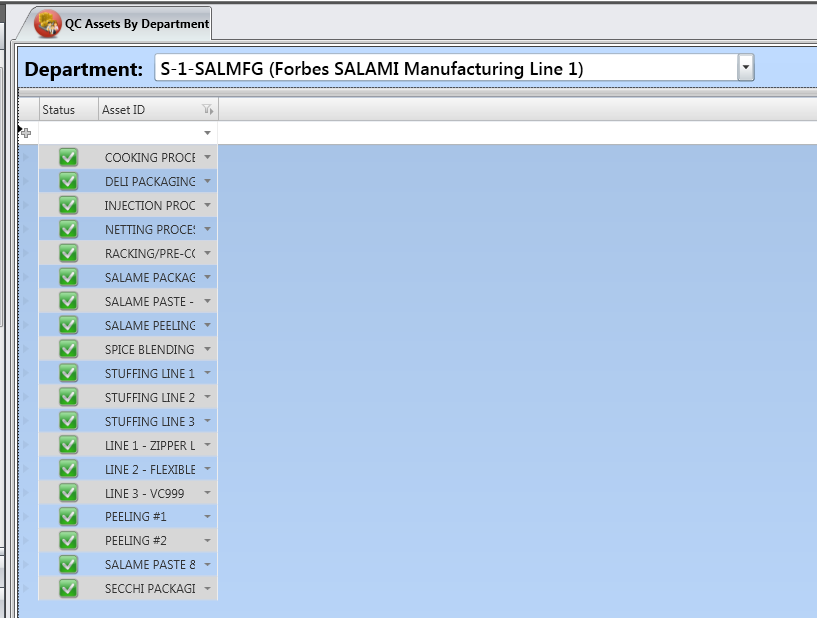
QC Assets by Department Maintenance
In order to access this screen, you need to have the "SD QC ASSETS BY DEPARTMENT" permission set for your user.
In the Department drop-down, select a Department. The departments are from the sf_ptdept_tbl table.
Assign Assets to the selected Department by adding Asset ID rows to this table. These are the same Assets entered in the QCAsset table.
Return to Scorecard/KPI

