GX:Corrective Action Report
From coolearthwiki
Revision as of 11:28, 13 December 2012 by Nrb (Talk) (New page: Chart Screenshot *This example report displays: **The relative amounts of corrective action reports for each screen **The relative amount...)
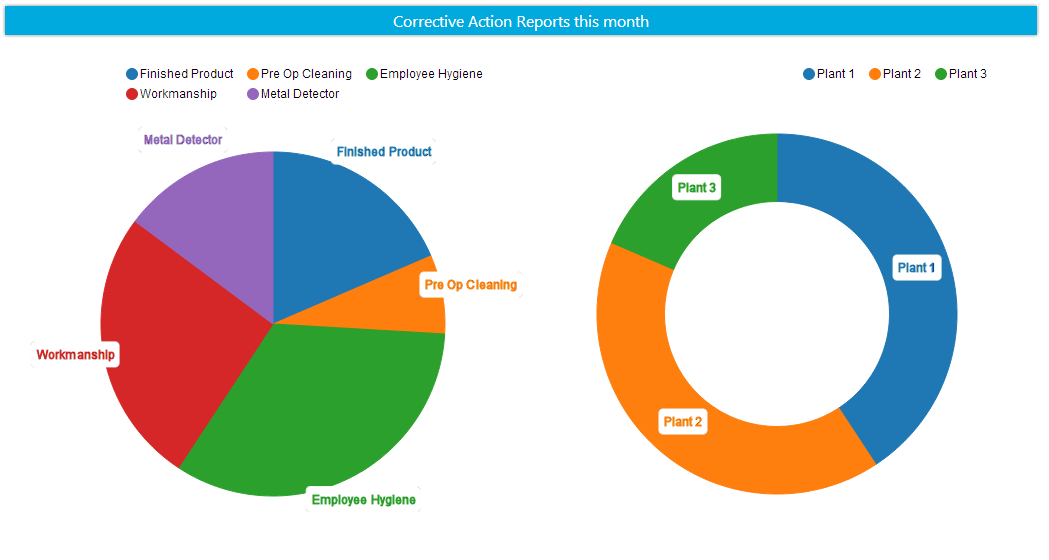
- This example report displays:
- The relative amounts of corrective action reports for each screen
- The relative amounts of corrective action reports for each plant
Useage
- Clicking on the labels above the chart will remove that element from the chart, and only display the remaining elements. Example: Clicking on Plant 1 will show the chart for only Plants 2 and 3
- Clicking on a area in the chart will drill down to a table showing all of the corrective actions for that category. Example: Clicking on Workmanship will display all of the Corrective Action reports filed for the Workmanship screen|QC_Workmanship|Workmanship screen in QC
